![](https://www.ibcs.com/wp-content/uploads/2016/08/IBCS_table_template_01-3_500px.png)
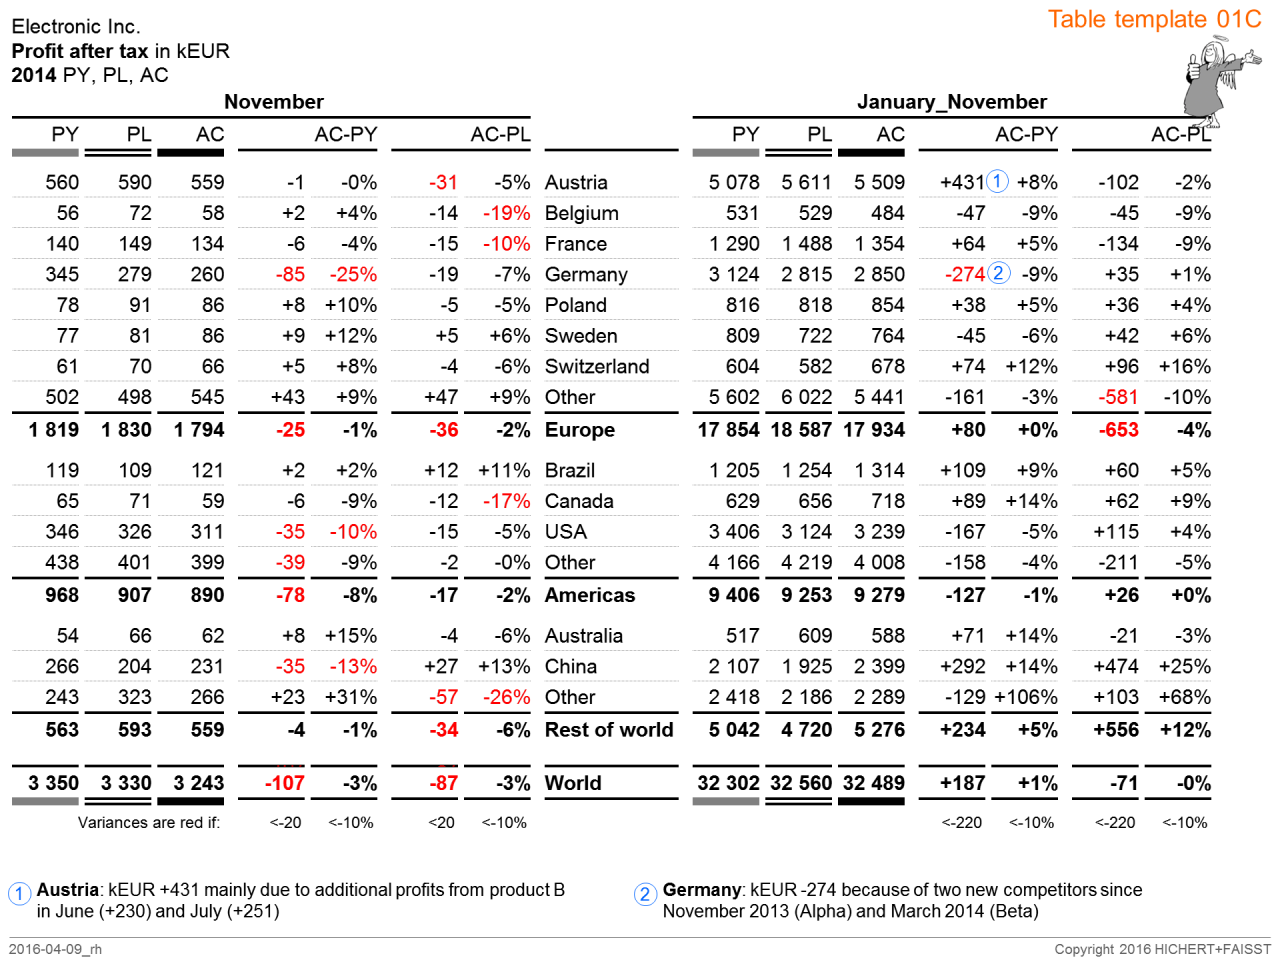
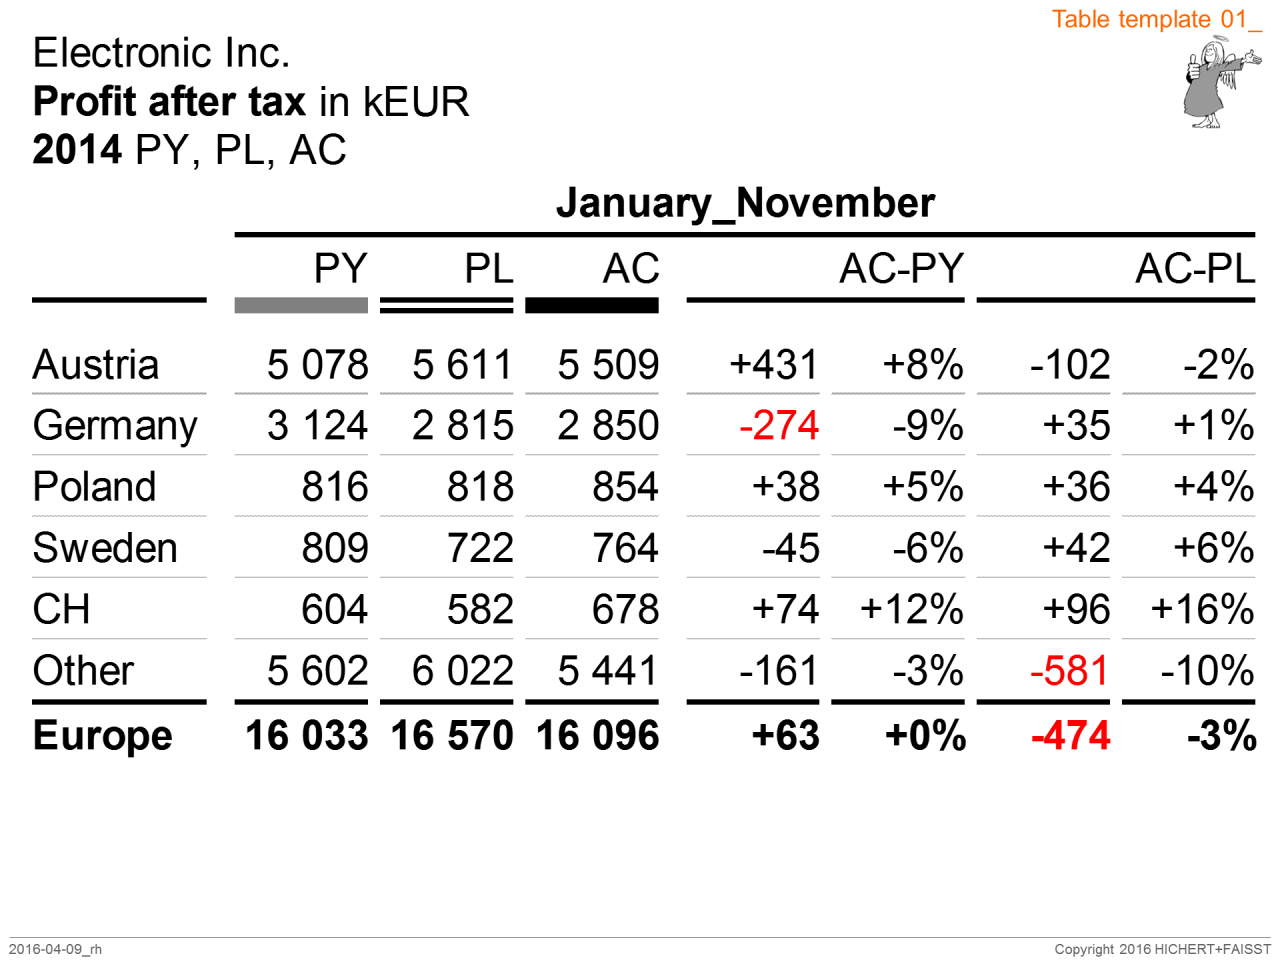
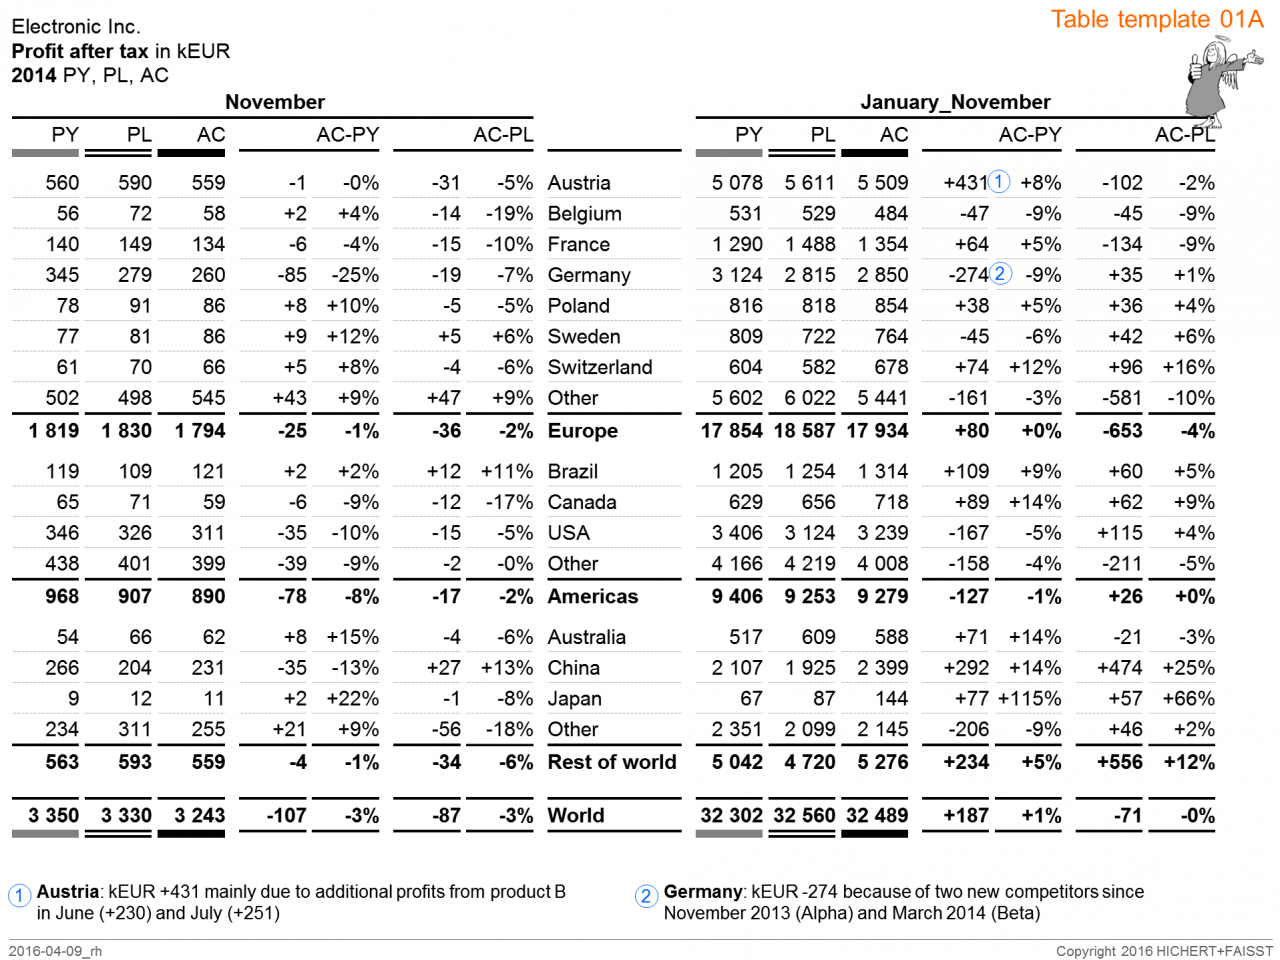
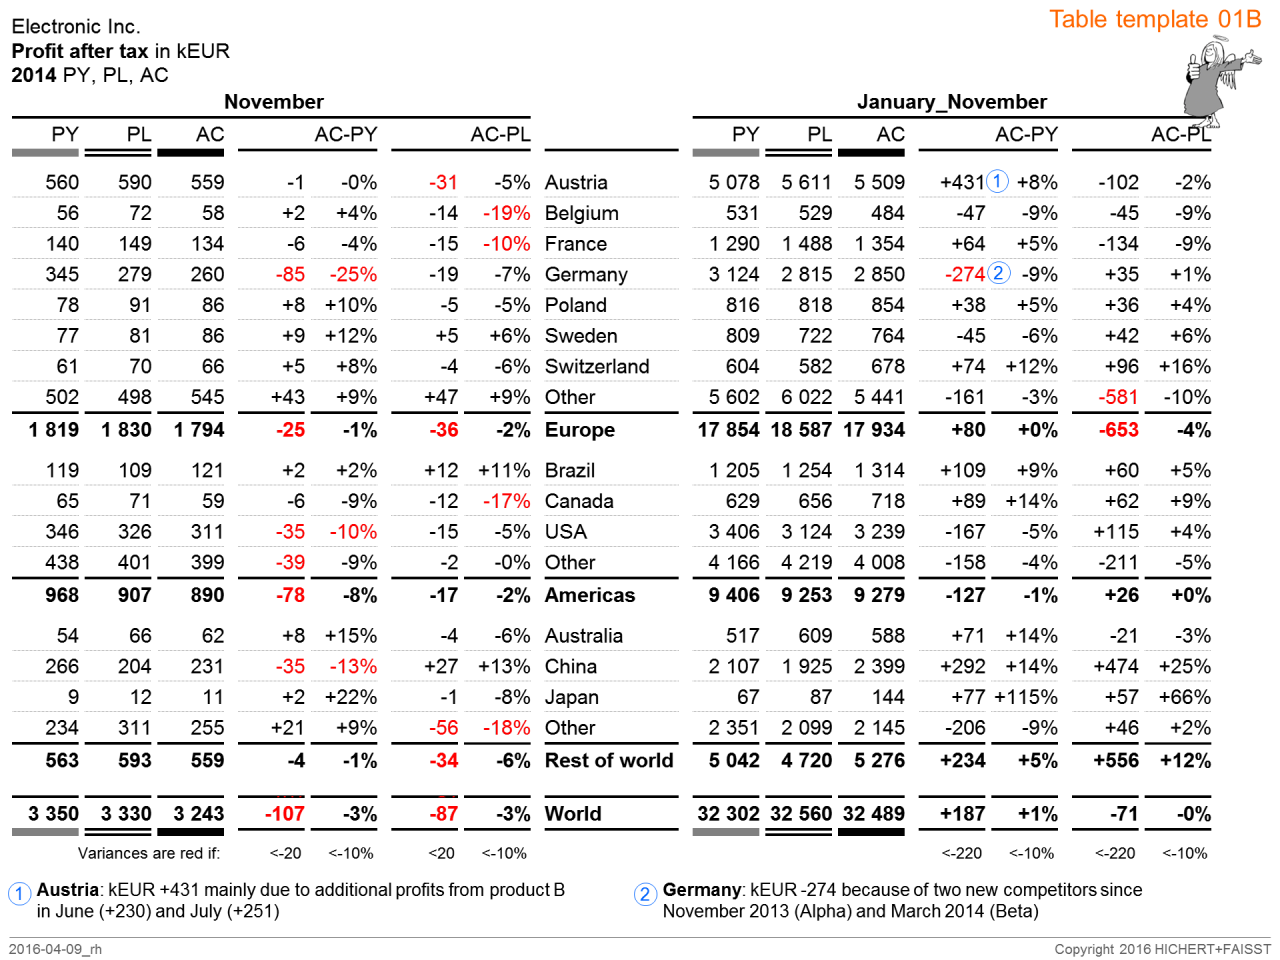
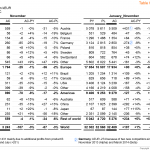
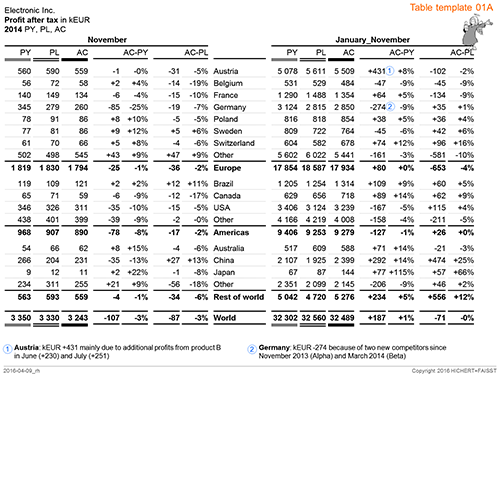
T01: Table with hierarchical rows and variance columns
Table template 01 presents one measure (Profit after tax) with rows showing a regional structure and columns showing absolute and relative variances to previous year and plan.
In this example, row headers are centered between monthly and year-to-date values in order to structure the two groups of seven columns each.
![](https://www.ibcs.com/wp-content/uploads/2016/08/IBCS_table_template_01-6-1280x960.png)
![](https://www.ibcs.com/wp-content/uploads/2016/08/IBCS_table_template_01-7-1280x960.png)
![](https://www.ibcs.com/wp-content/uploads/2016/08/IBCS_table_template_01-3-1280x960.png)
![](https://www.ibcs.com/wp-content/uploads/2016/08/IBCS_table_template_01-4-1280x960.png)
![](https://www.ibcs.com/wp-content/uploads/2016/08/IBCS_table_template_01-5-1280x960.png)
![](https://www.ibcs.com/wp-content/uploads/2016/08/IBCS_table_template_01-6-150x150.png)
![](https://www.ibcs.com/wp-content/uploads/2016/08/IBCS_table_template_01-7-150x150.png)
![](https://www.ibcs.com/wp-content/uploads/2016/08/IBCS_table_template_01-3-150x150.png)
![](https://www.ibcs.com/wp-content/uploads/2016/08/IBCS_table_template_01-4-150x150.png)
![](https://www.ibcs.com/wp-content/uploads/2016/08/IBCS_table_template_01-5-150x150.png)