


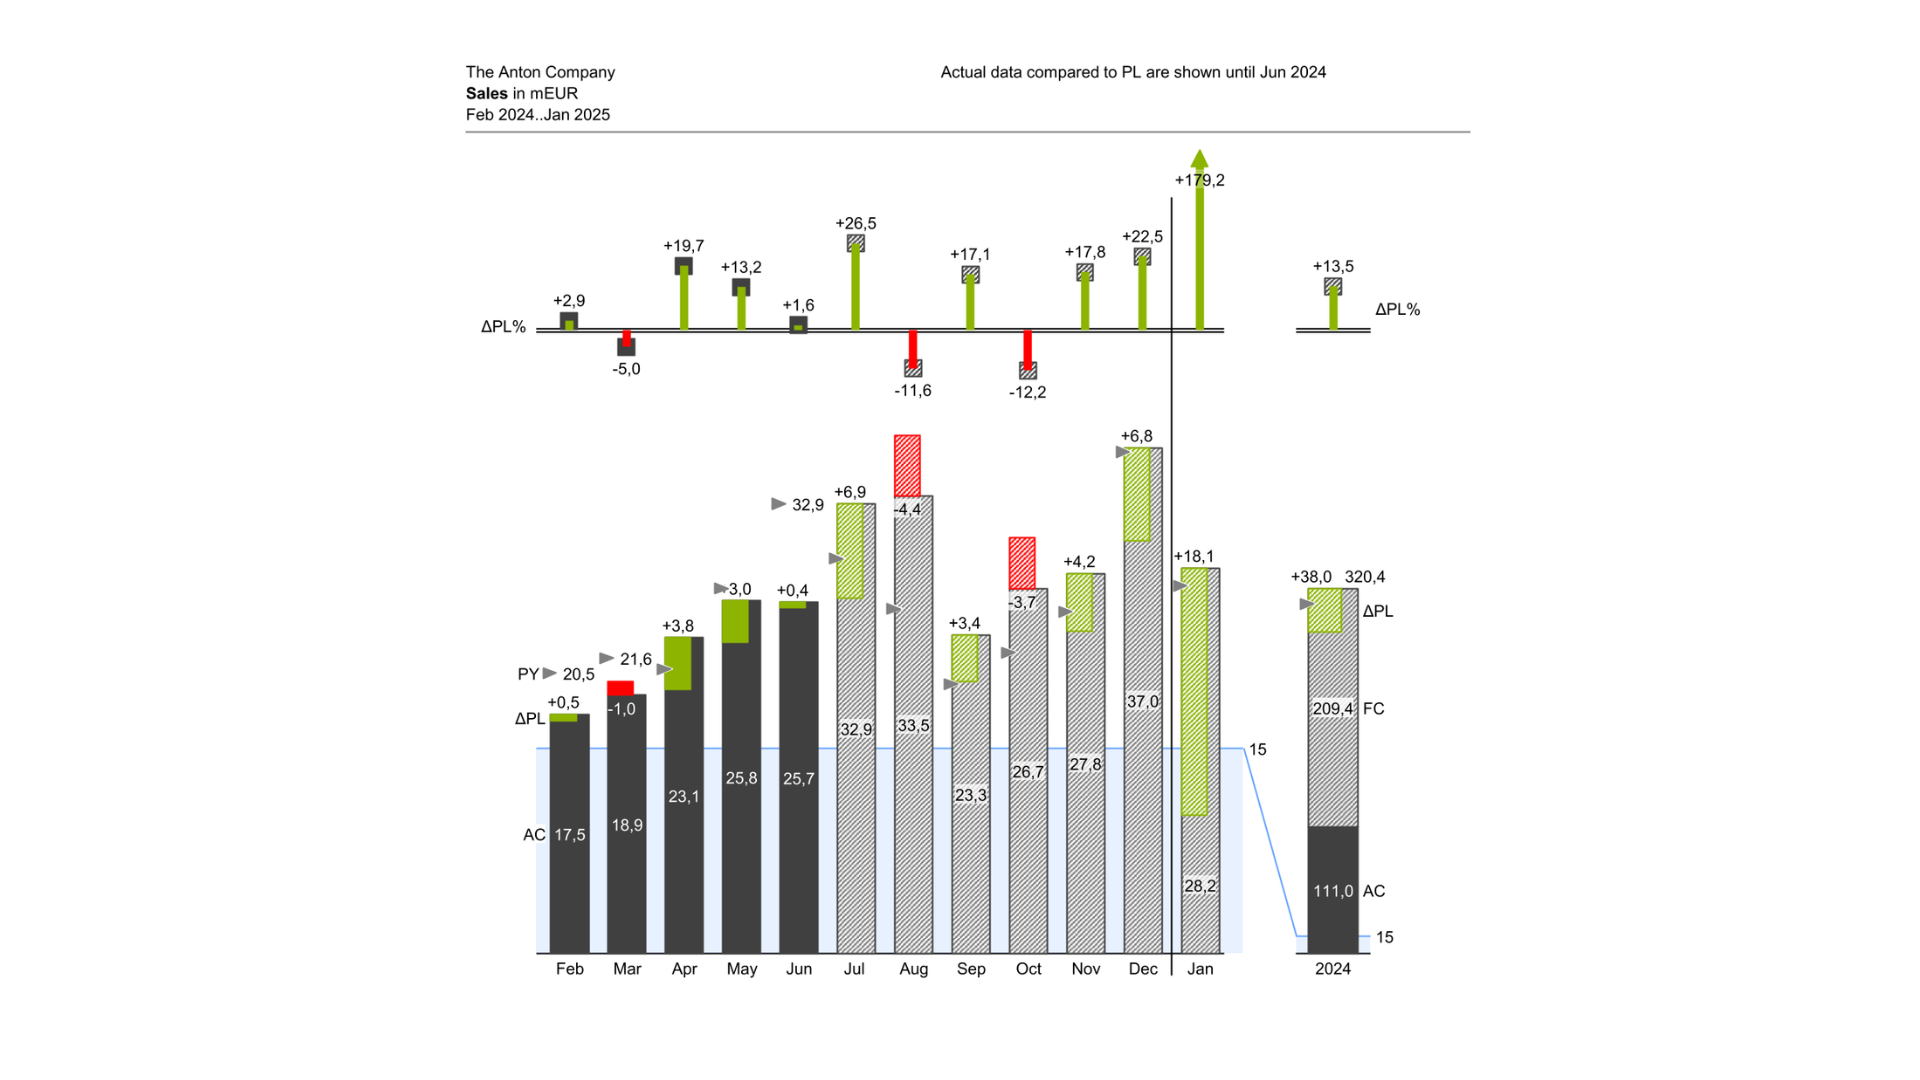
The first template visualizes monthly revenue (mEUR) using combined column charts of actuals (AC) and forecasts (FC), where actual columns are replaced by forecast columns for future months. A key feature is the representation of integrated variances to plan values (PL) within the columns, as well as percentage variances displayed in a separate pin chart.