


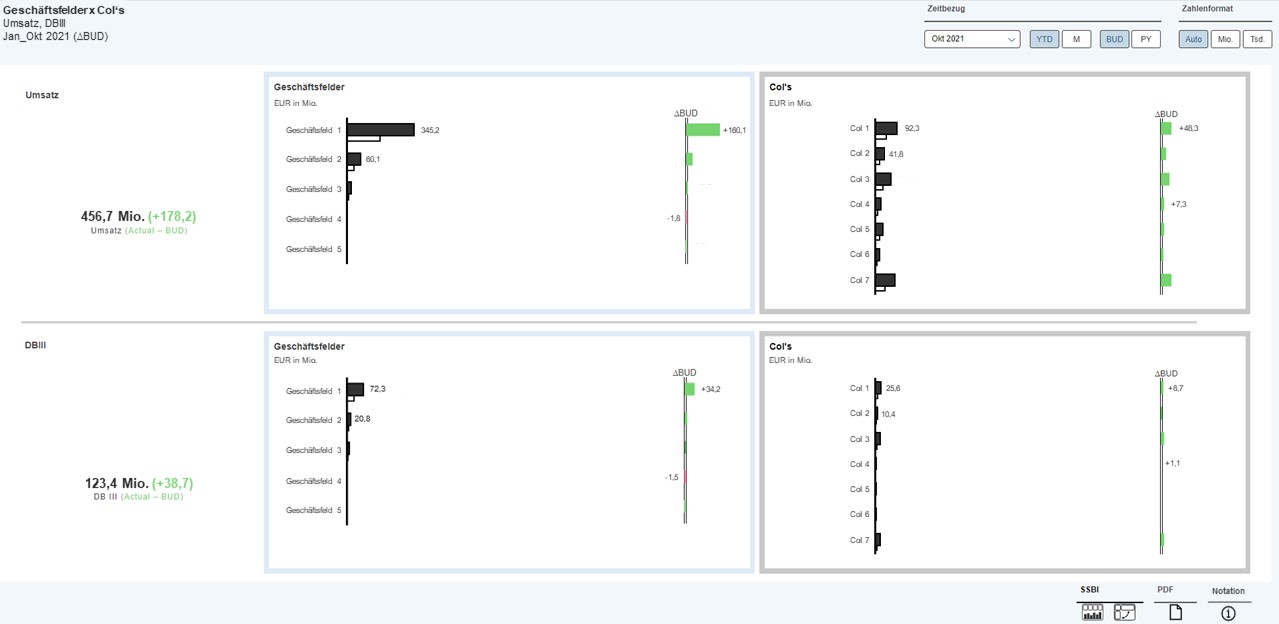
The visual analysis shows revenue and contribution margin by business unit (Geschäftsfelder) and CoI’s. In the current view, the data refers to Jan – Oct 2021 and shows a reference comparison to the budget of the same period.
The user has several options to interactively control the analysis. In the upper area there are various filters and functions for the time reference and the number format.
The charts are also assigned a color notation. A blue frame means that the corresponding diagram can be used as a visual filter. A gray frame means that the user can drill down one analysis level here.