


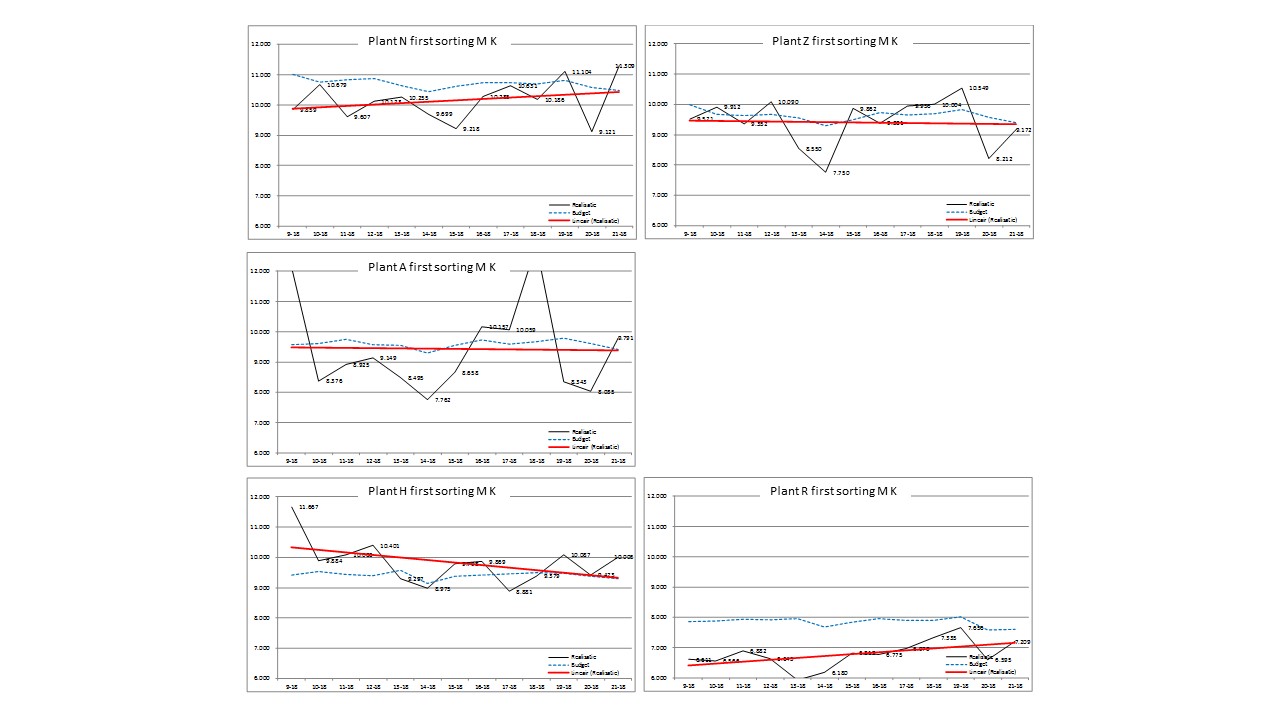
Chart used to show efficiency (pieces per manhour) of one machine during the last 13 weeks for all plants. Lines show budget (planning), actuals and the trend-line of the actuals.
Chart used to show efficiency (pieces per manhour) of one machine during the last 13 weeks for all plants. Lines show budget (planning), actuals and the trend-line of the actuals.